Target Audience: HES operators, SCADA engineers, energy company managers
Meta description: What does digitalization in the energy market really mean? We break it down with KPIs, a dashboard example, and a practical decision-support flow for hydro plants ending with the Hydrowise approach.
Keywords: digitalization in energy markets, data-driven decision system, decision support, HPP dashboard, KPI, SCADA integration, EPİAŞ data, imbalance management
Hook + problem definition
In the energy market, the “right decision” rarely comes from a single number. Price, generation, water/reservoir constraints, outage risk, market rules, and time all move at once. One team watches MCP/PTF, another is busy with flow and gates on-site, and another monitors equipment signals… Everyone works hard, yet decisions still end up fragmented.
This is exactly where digitalization becomes practical not as a vague “let’s automate everything” slogan, but as a system that unifies data, turns it into meaning, and ties it to action. EPİAŞ’s transparency approach and its data access channels (platform + web services) already strengthen the backbone of this transformation. [4][5][6] The real question is: how do you turn that into a decision system that balances revenue, risk, and operations on the hydro side?
- Digitalization is not collecting data it’s producing decisions: SCADA + market + maintenance data must meet in one place and drive action.
- EPİAŞ transparency data makes the market measurable; web services make automation realistic.
- Dashboards/KPIs are not “just reporting”: they should answer “where is deviation growing?” on an hourly basis.
- Data-driven decision support manages forecast error + operational risk + market uncertainty together (not one metric, but a decision package).
- The Hydrowise approach combines real-time SCADA processing, forecasting, and BI/reporting so HPPs can be managed from a single center.
What does “digitalization” mean in the energy market?
In energy, digitalization typically becomes real in three layers:
- Visibility: Collect data, standardize it, make it reliable
- Insight (Forecast/Insight): Extract signals forecasting, anomaly detection, risk scoring
- Action (Decision/Automation): Translate insight into business rules and decision flows
IEA’s perspective is similar: digital technologies can make energy systems more connected, efficient, and reliable, while also introducing new challenges such as cybersecurity and privacy. [8]
SHURA’s Türkiye-focused view highlights another angle: digital technologies create new business models and application areas in the energy transition; IoT, AI, and big data reshape both internal processes and value creation. [7]
What is a Decision Support System (DSS)?
A decision support system accepts a simple truth: humans make the decision. The system’s job is to bring the right indicators at the right time, in the right context, so decisions are faster and more consistent.
In energy markets, decision support is also used to monitor and score market behaviors so participants can adopt more data-driven bidding strategies. [12] The core idea is to institutionalize the pipeline: data → analysis → decision.
Why talk about data governance?
Because decision support is only as good as the data behind it. If bad data enters the system, it can produce confident but wrong recommendations. On the ground, the most common issues are simple: the same tag stored under different names across systems, timestamps that don’t align, alarms classified inconsistently…
That’s why the first step of digitalization isn’t “pulling data,” but defining the data and assigning ownership: Who produces which data? How often does it update? In what format? Who validates it?
On the EPİAŞ side, published datasets and web-service access put market data on a more standard, repeatable footing. When a similar standardization is designed on the plant side, dashboards earn trust and decisions stop being debated every day. [4][6][15]
Why is it more critical now?
- Data has exploded: SCADA is minute/second-level; markets are hourly; maintenance is event-based.
- Uncertainty is higher: weather/hydrology, demand shifts, transmission constraints, price volatility.
- Regulation and transparency are stronger: EPİAŞ Transparency Platform operates with a legal basis for publishing datasets. [4]
- In studies such as Competition Authority specialization theses, the transparency framework of the wholesale electricity market is examined in detail; the impact of data sharing on market performance and the debate around “critical data” are emphasized. [9] This is why digitalization is not only about technology it’s tightly linked to market design.
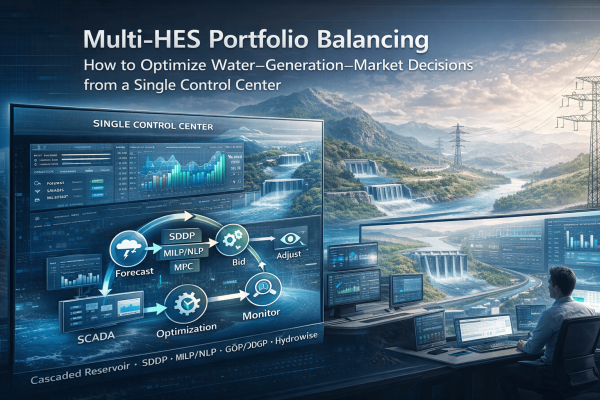
How does it work?
The most practical way to build a digital decision system is not a “one-shot mega project,” but a phased flow.
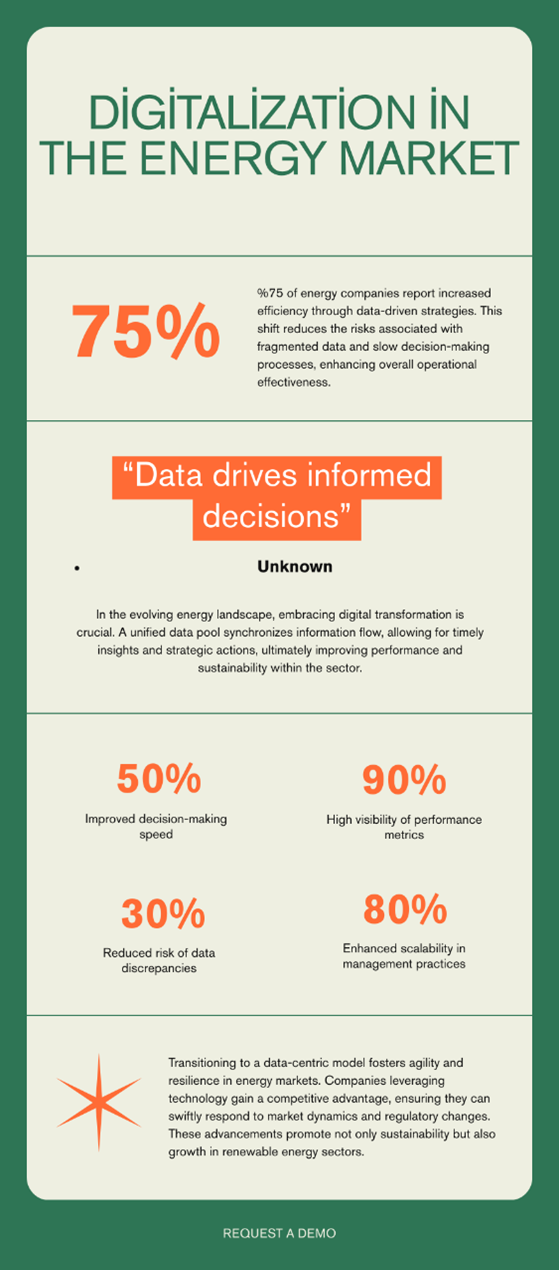
Infographic
Figure-1
Phase 1 Data collection and unification
- SCADA/OT data: generation (kW/MW), flow, gate position, reservoir level, vibration/temperature, etc.
- Market data: MCP/PTF, SMP/SMF, volumes, announcements, transparency datasets
- Operational data: maintenance records, outages, asset health, shift notes
On the EPİAŞ side, data access isn’t limited to manual Excel downloads; it can be automated via web services. And new service transitions and security updates (for example, changes in the way you obtain TGT tickets) are a reminder that integrations are living systems, not “set and forget.” [5][6]
Phase 2 Quality control and interpretation
Once data is unified, two questions must be answered:
- Is the data correct? (missing points, outliers, sensor drift)
- What is it telling us? (trend, anomaly, performance drop)
Reporting alone is not enough. Making SCADA “smart” through outlier detection, operating regime classification, and better loading strategies can be strengthened by data-mining-based modules. [11]
Phase 3 KPI and decision rules
This is where digitalization either becomes real or stays as “another reporting project.” KPIs must be selected not for monitoring, but for decision-making.
Example decision rule:
“If the gap between planned generation and realized generation exceeds band X → produce an intraday (GİP) correction recommendation.”
(Data feeding the rule: SCADA + plan + market time)
Phase 4 One-screen delivery (Dashboard)
Renewasoft’s reporting & BI approach emphasizes turning SCADA/IoT data into meaningful insight so managers can track real-time analysis and trends. [2] The goal is not “pretty charts” it’s one-glance decisions.
Impact on the HPP / energy facility side
For a hydro plant operator, digitalization touches five very concrete pains:
1) Why do deviation meetings never end?
Because the data lives in different places. The trading team sees price, operations sees flow, maintenance sees risk each in their own system. If those perspectives don’t meet on one screen, decisions arrive late.
2) Why is forecast error expensive?
You set a day-ahead plan; then flow/efficiency changes on-site; the realized generation drifts off plan. That gap becomes a direct cost/revenue line. That’s why deep-learning-based price forecasting is actively studied (e.g., hourly MCP/PTF forecasting in Türkiye’s DAM). [10]
3) Why can’t operational risk be translated into “trading language”?
Vibration rises on a turbine, but that signal doesn’t show up in bidding decisions as a clear score. Smart SCADA and knowledge-discovery modules allow operators to see comparative KPIs across longer horizons and distinguish operating regimes more clearly. [11]
4) We have data, but we don’t trust it
Sensor errors, missing records, latency… Digitalization is not only “collecting.” It’s data quality + traceability.
5) Manual management collapses as you scale to multi-plant portfolios
You can somehow manage a single plant manually. Add two or three plants and you’re suddenly balancing different basin conditions, maintenance cycles, and price exposures. Decisions fragment fast. This is exactly why a digital decision system becomes a scaling requirement.
Example scenario / mini calculation / flow
The example below is not financial advice; it’s a simplified scenario to make the logic tangible.
Scenario: “Reducing deviation” to turn invisible money visible
A hydro plant has an hourly plan for the day.
In some hours, generation falls below plan due to flow/efficiency.
Result: deviation/imbalance cost rises and the team becomes reactive.
Mini KPI set:
- Hourly Planned Generation (MWh)
- Hourly Realized Generation (MWh)
- Hourly Deviation (MWh) = Realized − Planned
- Hourly Risk Score (maintenance/fault signals)
- Hourly Market Price / Reference (MCP/PTF, SMP/SMF, etc.)
Let’s say over a month:
- There are 200 “critical hours” (hours with high price impact)
- Average deviation in those hours: -1.5 MWh/hour
- With “digital alerts + early correction,” one-third of that deviation is reduced: 0.5 MWh/hour improvement
- Use a simplified reference price: 2,000 TL/MWh
Approximate impact (purely illustrative):
0.5 MWh/hour × 200 hours × 2,000 TL/MWh = 200,000 TL/month improvement in “deviation effect.”
The main lesson: Digitalization isn’t always a big revolution. Sometimes it’s a small difference in critical hours yet that small difference becomes a real line in the income statement.
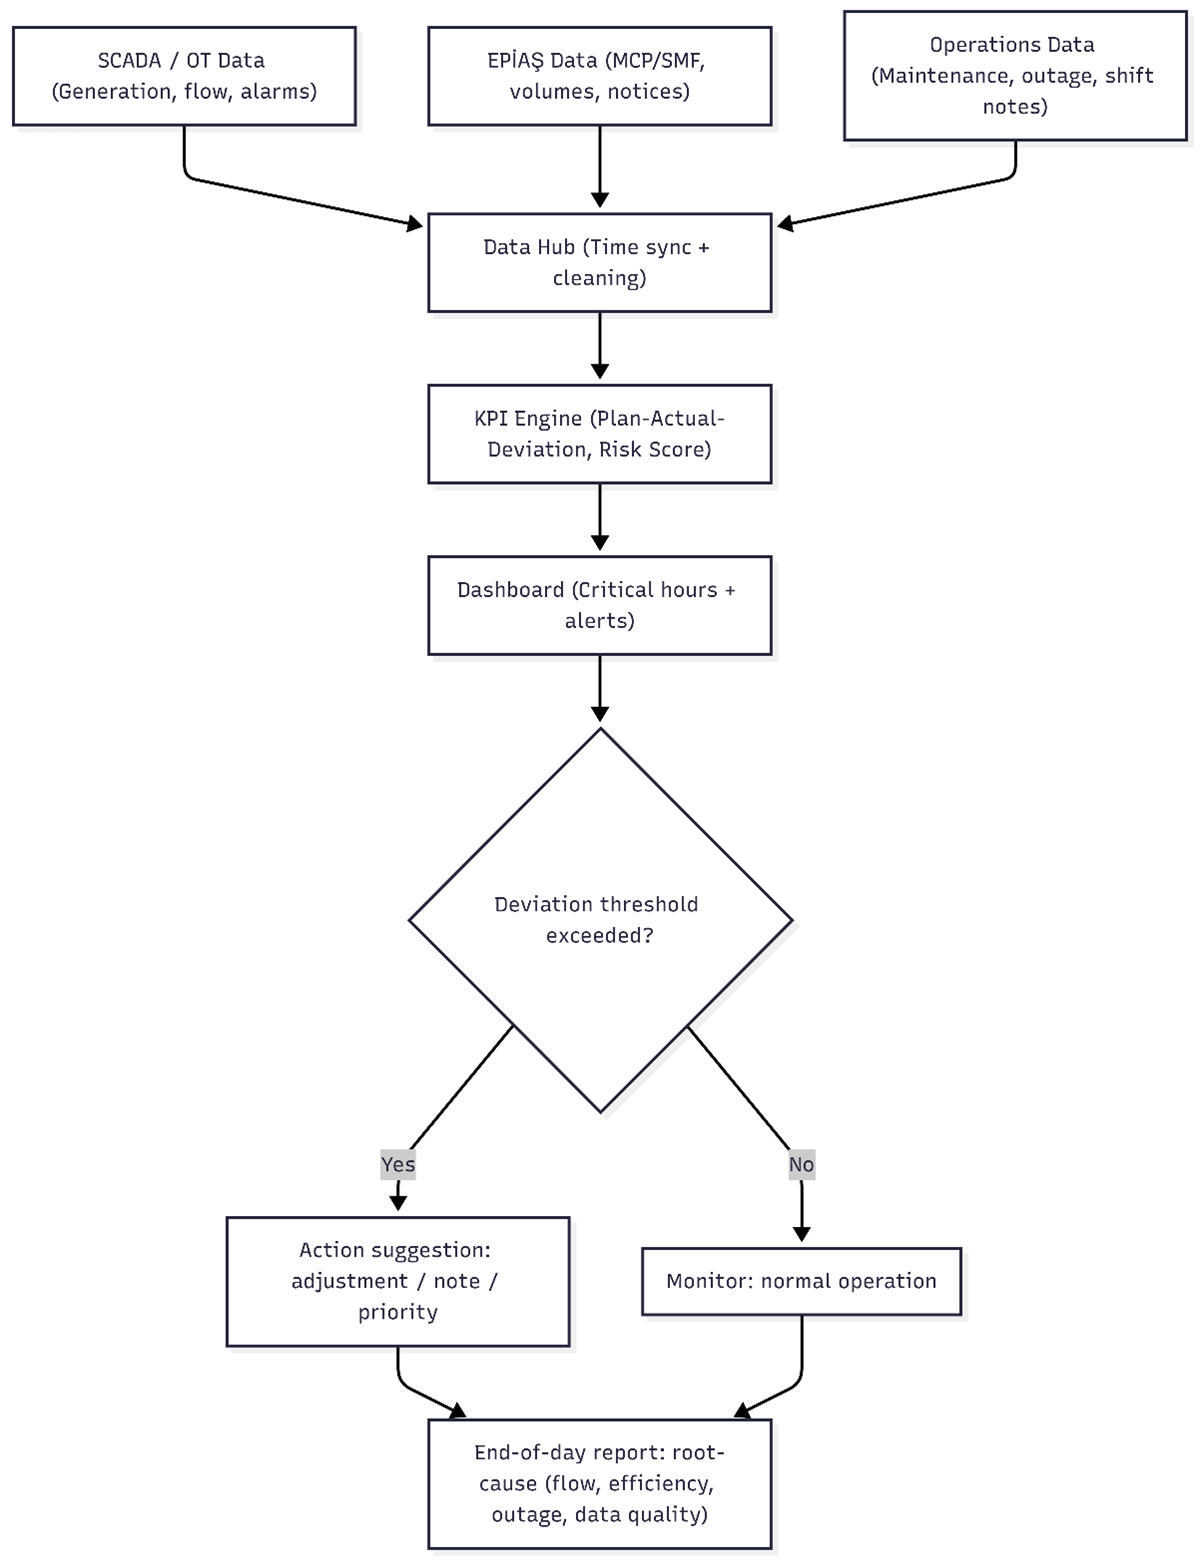
Flow: The “most minimal” version of a decision system (MVP)
- EPİAŞ data is pulled automatically (web services). [5][6]
- SCADA generation data flows in real time. [1][3]
- Dashboard shows “Plan–Realized–Deviation” instantly. [2]
- If a deviation threshold is exceeded, an “adjustment/action” recommendation is produced.
- End-of-day report classifies the reason: “flow, efficiency, fault, or data quality?” [11]
Figure-2
- If KPIs are only displayed, the team still makes manual decisions and delays remain.
- If KPIs are tied to action (threshold/alert/recommendation), digitalization produces real value.
- Security/integration changes in web services are part of operations; you must plan system maintenance accordingly. [6]
Data-Driven Decision System Approach
In energy facilities, digital decision systems aim to unify multiple data sources into a single operational flow. The goal is to transform fragmented data into actionable insights.
This approach typically consists of three layers:
1) Centralized visibility
A single source of truth where trading, operations, and maintenance teams align on the same data.
2) Insight layer
Meteorological, hydrological, and operational data are used to generate forecasts, trends, and risk indicators.
3) Decision layer
Dashboards and KPIs are designed not just for reporting, but for triggering actions.
With this structure, data shifts from being monitored to actively driving decisions.
Example Dashboard/KPI set (ideal for a demo)
- Market KPIs: hourly MCP/PTF & SMP/SMF trend, critical hours, volatility indicator
- Generation KPIs: planned vs realized, forecast error, availability
- Water/reservoir KPIs: reservoir level, flow trend, water value indicator (site-specific)
- Maintenance/health KPIs: risk score, alarm count, vibration/temperature trends
- Decision KPIs: deviation band, action recommendation (alert/priority), “top 5 critical hours today”
Demo CTA (practical offer)
If you want, a demo doesn’t have to be a generic slideshow. It can be built around a scenario that feels like your actual operation:
- 1 week of sample data (SCADA + EPİAŞ data)
- A minimal dashboard with 10 KPIs
- Deviation band + critical hours screen
- A one-page “end-of-day decision report”
| Hour | MCP Trend | Plan (MWh) | Actual (MWh) | Deviation |
|---|---|---|---|---|
| 18:00 | ↑↑ | 12.0 | 11.2 | -0.8 |
| 19:00 | ↑↑↑ | 12.0 | 10.9 | -1.1 |
| 20:00 | ↑↑↑ | 11.5 | 11.3 | -0.2 |
| 21:00 | ↑↑ | 11.0 | 10.4 | -0.6 |
Table-1
Table-1 A sample panel enabling combined tracking of MCP trend, planned vs realized generation, deviation, and risk level during critical hours; used to trigger action recommendations when deviation grows.
If we simplify the architecture: sources (SCADA/OT, market, maintenance) → integration (automated pull, time sync) → processing (KPI, forecast, risk score) → presentation (dashboard, report, alert). Separating these layers makes the system both scalable and manageable. EPİAŞ web-service access helps automate the market side of this chain; on the plant side, cleaning SCADA streams and producing standardized KPIs follow the same logic. [6][2]
Frequently asked questions
Conclusion + CTA
Digitalization in the energy market isn’t “more data.” It’s fewer surprises. On the hydro side, surprises show up during critical hours: flow shifts, efficiency drops, risk signals rise, market conditions move… With fragmented screens, it’s easy to miss the moment.
Data-driven decision systems combine EPİAŞ transparency data [4][5][6] with the plant’s real-time SCADA world [1][3] and turn it into a decision workspace through BI/reporting. [2] As a result, teams shift from reactive firefighting to a more proactive rhythm.
If you would like to learn more about data-driven decision systems and digitalization approaches in hydropower operations, feel free to contact us: