Audience: Hydropower (HPP) operators, energy trading teams, SCADA engineers, product managers
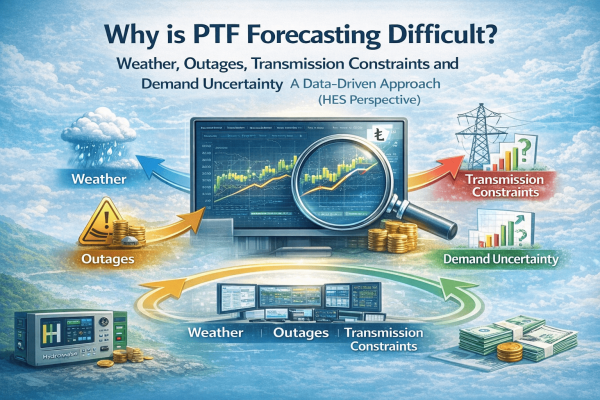
Why Is PTF Forecasting So Hard? Weather, Outages, Grid Constraints, and Demand Uncertainty — A Data-Driven View for Hydropower Operators
Hook + problem statement
Same reservoir, same turbines, same installed capacity yet tomorrow’s revenue can look wildly different depending on where the PTF lands hour by hour.
On paper, the task sounds straightforward: “Forecast the 24 hourly day-ahead prices.”
In reality, PTF is not just a continuation of yesterday’s curve. It is the market’s answer to a constrained clearing problem shaped by weather-driven load swings,
renewable variability, outages, and transmission constraints.
And because PTF comes out of an optimization-based matching of bids and constraints, it behaves less like a smooth time series and more like a system that can switch
regimes when conditions change [1][5]. That’s why PTF forecasting is not only about choosing an algorithm it’s about building the right data foundation,
designing features around what is known at bid time, and closing the loop with operational reality [2][6].
- PTF is a market-clearing outcome, not a simple time series so “yesterday → tomorrow” patterns won’t hold under changing conditions [1][5].
- Weather moves both sides of the market: it shifts demand (heating/cooling) and supply (wind/solar/hydro inflows), and small forecast errors can change the marginal unit [5][7].
- Outages create discrete supply shocks, especially painful during peak hours, often triggering price spikes [6].
- Grid constraints can break the merit order, pushing the system into a different operational equilibrium and price regime [9][10].
- A robust approach combines high-quality data + leakage-free features + scenario/probabilistic outputs, then links price insights to HPP operational risk (availability, flow, constraints) [2][3][5].
What exactly are we forecasting?
In Turkey’s Day-Ahead Market, PTF (Piyasa Takas Fiyatı) is the hourly clearing price derived from the matching of supply and demand bids under market and system constraints [1].
Forecasting PTF means forecasting where that clearing point will sit tomorrow for each hour, given what participants are likely to bid and what the system can realistically deliver.
Why electricity prices behave differently
Electricity is hard to store at scale, the balance is instantaneous, and demand can be inelastic in the short run.
This combination produces volatility, nonlinearity, and spikes, which the academic literature consistently flags as central challenges for price forecasting [5][6].
In other words: average accuracy matters, but tail events often dominate financial risk [6].
The “big four” drivers behind forecast difficulty
For our topic, we focus on four practical drivers that repeatedly show up in both research and market operations:
- Demand uncertainty: load forecast errors shift the marginal unit and can amplify volatility [5][10].
- Weather: affects load and renewables simultaneously; hydro is influenced through meteorological and hydrological pathways [5][7].
- Outages: sudden unavailability alters the supply curve abruptly—spike territory [6].
- Transmission constraints: congestion and system limits can force non-economic dispatch patterns and regime changes [9][10].
Four main forces (weather, outages, transmission constraints, demand uncertainty) that make PTF forecasting difficult, and reference indicators for the 2024 Turkish market.
PTF is the output of a constrained market-clearing process. Forecasting it is essentially forecasting tomorrow’s supply-demand intersection under constraints,
not merely extrapolating historical prices [1]. This is why models that ignore system state (demand uncertainty, grid constraints, outages) tend to fail exactly when it matters most.
How it works
Variables: the driver families that matter
Across the literature, the most actionable variable groups are consistently framed as follows [5][6]:
- Price history & calendar effects: hour-of-day, weekday/weekend, holidays, seasonal patterns.
- Load and load uncertainty: expected load plus uncertainty proxies (forecast error bands) [5].
- Supply stack and generation mix: gas, coal, hydro, wind, solar levels; marginal fuel indicators [7][8].
- Fuel and macro proxies: gas prices, FX effects, broader cost drivers depending on context [8].
- Grid/system indicators: congestion signals, constraint regimes, planned interventions [10].
- Unit availability: planned maintenance and forced outages [6].
Data sources: where the inputs come from
A practical Turkey-focused pipeline typically combines:
- EPİAŞ Transparency Platform: market and system data visibility [2].
- EPİAŞ Transparency technical docs: how to access and integrate the services reliably [3].
- Weather forecasts: temperature, wind speed, solar irradiance, precipitation—ideally regionally granular.
- Grid signals (ENTSO-E / national sources): constraint signals, planned works, congestion hints [10].
- Plant SCADA/EMS: for HPPs—flow, head, unit status, kW output, gate positions (crucial for “quantity risk”).
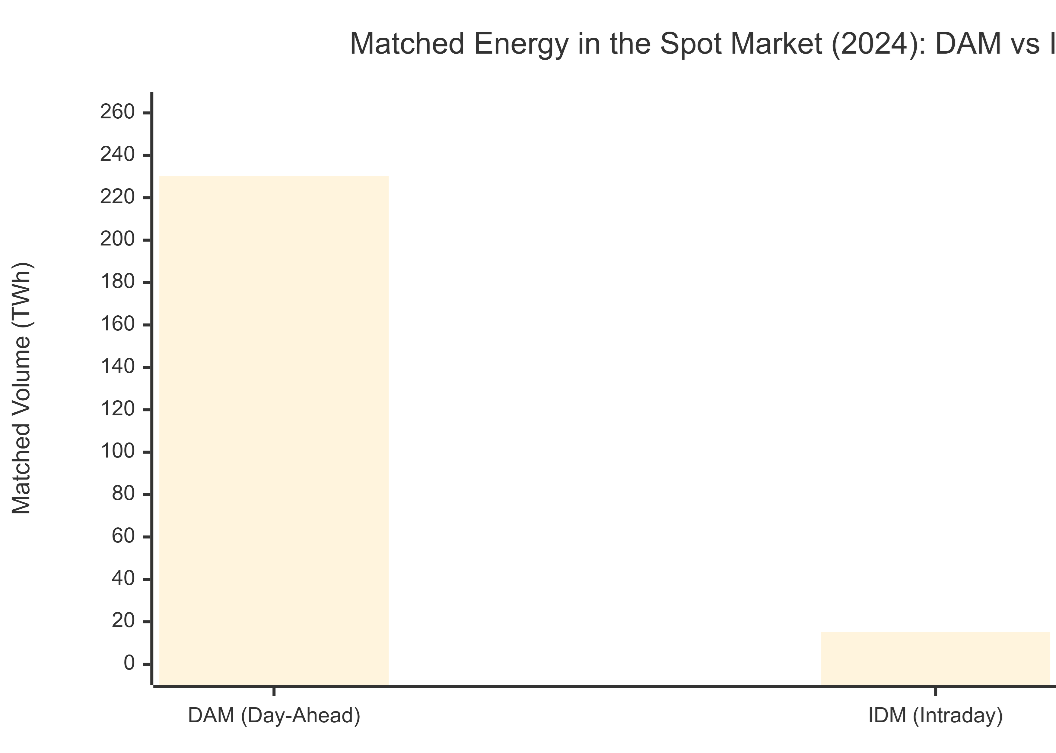
Figure 2 Comparison of matched energy quantities in the spot market in 2024: GOP 230.16 TWh, GIP 15.17 TWh.
GOP’s role as the “main planning and liquidity” center increases the critical value of the PTF forecast; GIP is positioned as a correction band in uncertainty and deviation management. [11]
Feature engineering: the “known-at-bid-time” rule
Most production failures in PTF forecasting are not caused by the choice of model—but by feature design.
Rule 1: No leakage ever.
If a feature includes information that is only known after delivery (e.g., realized load or realized generation),
the model will look great in backtests and fail in live operation.
Rule 2: Align features to the forecast horizon.
For day-ahead, use forecasts and plans available before gate closure (weather forecasts, load forecasts, planned maintenance).
Realized variables are fine for training and diagnostics, but you must replace them with bid-time proxies in production [5][6].
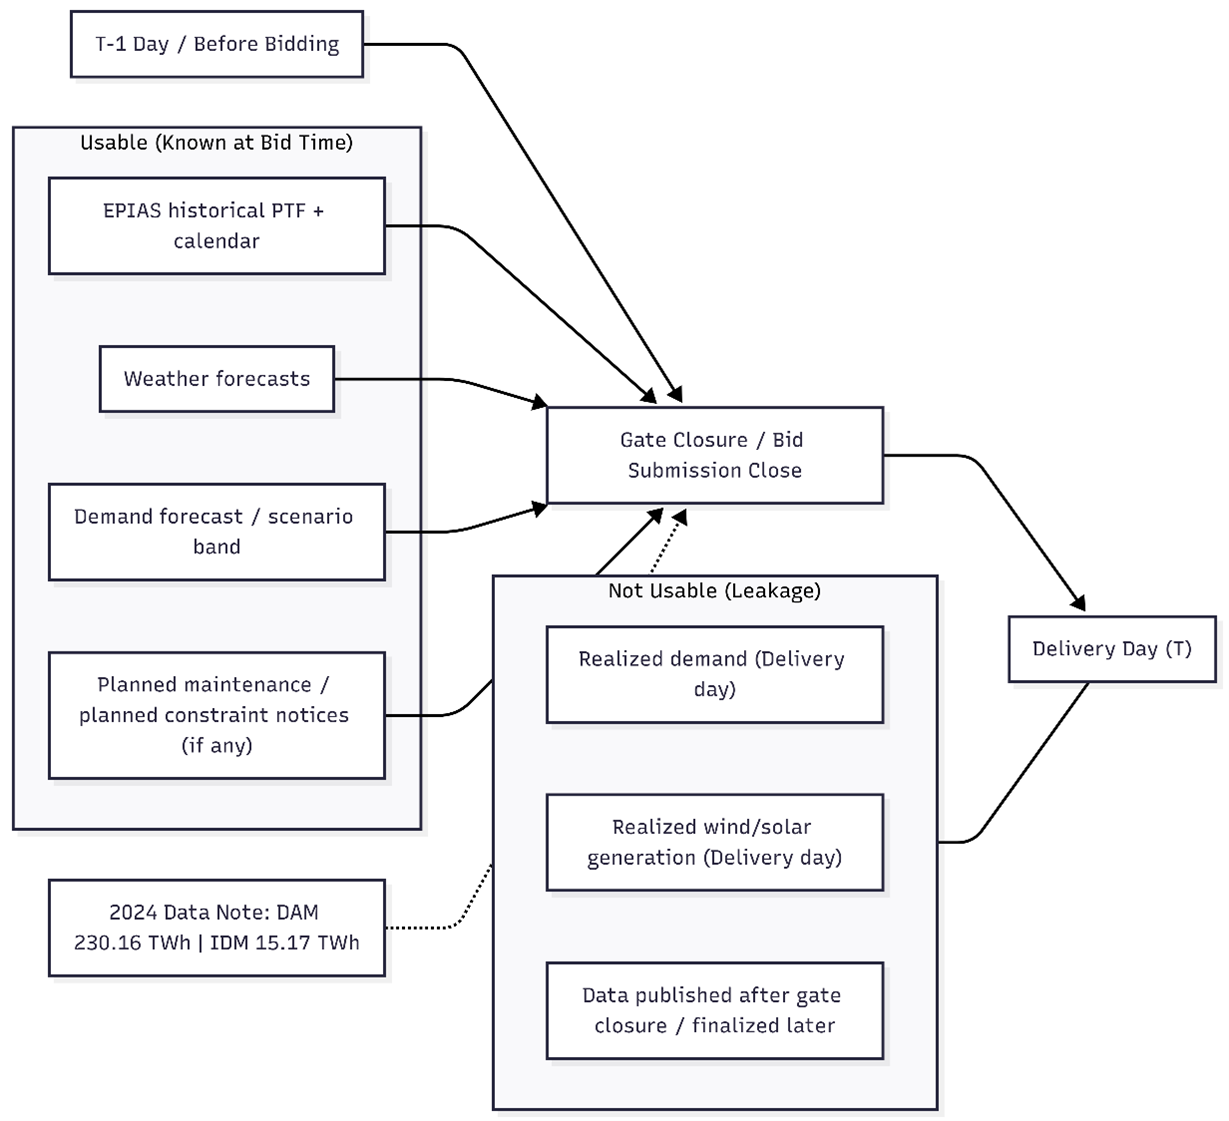
Figure 3. The “known-at-bid-time” principle in day-ahead PTF forecasting. It shows the distinction between data that can be used as model inputs at gate closure
(EPIAS historical PTF, weather forecasts, demand scenarios, planned maintenance/constraint notices) and realized data that becomes available on the delivery day and therefore cannot be used in the model.
These mistakes inflate test performance and break real deployments:
- Using realized (tomorrow) load as an input for day-ahead price prediction
- Pulling datasets published after gate closure into day-ahead features
- Computing rolling statistics that “peek” into future hours
A simple audit question fixes a lot:
“Was this value available at the time the forecast was issued?”
What it means for hydropower plants
Why PTF forecasting is more operational for HPPs
For thermal generation, price forecasting often revolves around fuel costs and market fundamentals.
For hydropower, there is an extra layer: you can shift water across hours. That makes price forecasting directly actionable—but also more sensitive to operational reality.
For HPPs, value comes from combining:
- Price insight (where PTF might go), and
- Production confidence (can we actually deliver in those hours?)
That second layer depends on flow uncertainty, unit availability, environmental constraints, and plant condition so PTF forecasting must be coupled with operational risk visibility.
Where forecast errors turn into money
- Moving water into the wrong hours (missed peaks)
- Getting the price right but the quantity wrong (availability/flow shifts)
- Last-minute reactive adjustments (decision quality drops)
- Risk appetite tightens as uncertainty grows (commercial pressure increases)
PTF alone doesn’t determine an HPP’s revenue; on the ground, the rule of thumb is simple: revenue = price × delivered volume.
The electricity price forecasting literature consistently points out that prices become harder to predict under uncertainty and tail events
and those same hours are usually when operational pressure is highest as well (peak demand, volatile wind/solar output, outage risk,
and a higher probability of grid constraints) [5][6].
That’s why a solid PTF approach for an HPP can’t stop at “Where will the price be tomorrow?”
It also needs to answer “How confident am I that I can deliver in those hours?” and turn the result into a practical decision band.
Example scenario / mini flow
Scenario: “Cold evening + wind uncertainty + constraint risk”
Assume tomorrow you see:
- Cold front risk in the evening → higher demand
- Wind forecast with wide error bands
- Planned grid work increasing constraint probability
- A turbine health signal moving closer to a warning threshold
Goal: Manage 17:00–22:00 with a balanced revenue-risk plan.
Decision flow
- Build demand scenarios: normal / cold / very cold
- Represent wind not as a single number but as an uncertainty range
- Treat grid constraints as a regime switch (constraint/no constraint) [10]
- Split HPP production into “secure” vs “optional” bands (SCADA-based)
- Output: hourly PTF distribution + action bands (not a single point)
Step-by-step flow (decision logic)
- Build demand + weather scenarios
Normal / cold / very coldFor each scenario, define an hourly demand deviation band
- Bring renewable uncertainty into the model
Don’t treat wind/solar output as a single number—use a forecast range (P10–P50–P90)That range changes the shape (slope) of the supply curve, which shifts the PTF distribution [5][6]
- Treat transmission constraints as a “regime”
No constraint / constraint active (regional bottleneck)If constraints bind, the marginal unit can change [10]
- Add HPP production risk (SCADA + maintenance signals)
If Unit 2 shows elevated risk, don’t fully rely on it during peak hoursSplit the plan into a “secure generation” band and an “optional generation” band
- Output: hourly PTF distribution + action band
Instead of “increase water in these hours,” use:“increase water in these hours—but if the risk triggers, here’s the fallback plan.”
Mini note: This is not financial advice; the goal is to make the decision logic concrete.
- Calendar: hour/day/holiday/seasonality
- Load: forecast + uncertainty bands, temperature-based indicators
- Supply: generation mix, marginal fuel proxies, availability
- Grid: constraint indicators, planned works, congestion regimes
- Market: volatility, spread, spike precursors
Infographic Draft
DRIVER LAYER (4 Core Forces)
DATA LAYER (Sources)
FEATURE LAYER (Families)
| DRIVER LAYER (4 Core Forces) | DATA LAYER (Sources) | FEATURE LAYER (Families) |
|---|---|---|
| Weather: Precipitation and temperature directly affect reservoir inflows. | EPİAŞ Transparency: Historical PTF, generation/consumption, and DAM (GÖP) datasets. | Calendar: Day type (weekday/weekend), peak hours, and holiday codes. |
| Outages: Unplanned plant or transmission outages constrain available supply. | Weather Forecasts: Regional temperature and precipitation projections. | Lagged Price / Volatility: Price lags from previous periods (p-24 and beyond). |
| Transmission Constraints: Grid bottlenecks create regional price separation. | Grid Indicators: TEİAŞ Load Forecast Plan (YTP) and constraint indices. | Load Forecast: Forecasted load level and model error band. |
| Demand Uncertainty: Shifts in consumption behavior distort price formation. | Plant SCADA: Reservoir active storage and real-time generation signals. | Wind/Solar Band (RES/GES): Forecast ranges for wind and solar output. |
Marginal Fuel Proxy: Cost indicators for natural gas and coal.
Constraint Flag: Transmission regime and supply-constraint markers.
Infographic – 1
An end-to-end blueprint that makes PTF forecasting systematic drivers → data sources → feature families → scenario/distribution outputs → an HPP decision band.
2024 Türkiye market scale and generation-mix indicators are included for context.
Data-Driven Decision Workflow for PTF Forecasting
In many organizations, price forecasting, operational data, and market decisions are handled in separate workflows. This separation creates misalignment:
- Trading focuses on price signals
- Operations focuses on physical constraints
- Finance observes the mismatch at settlement
To reduce this gap, PTF forecasting needs to be part of a unified decision workflow rather than a standalone analytical task.
A practical data-driven workflow typically includes:
Scenario-based forecasting
- Instead of a single hourly price forecast, multiple scenarios (e.g., normal / high demand / constrained system) are evaluated to reflect uncertainty.
Operational data integration
- Plant-level signals such as flow, unit availability, and constraints are incorporated to assess whether forecasted price opportunities are actually deliverable.[2][3][10]
Market alignment
- Forecast outputs are interpreted together with market mechanisms (GÖP planning, GİP corrections, DGP flexibility) to support actionable decisions.
Risk-aware outputs
- Instead of point estimates, outputs are expressed as price distributions and decision bands, helping teams manage both revenue potential and deviation risk.
A structured forecasting workflow requires aligning data, timing, and decision processes across trading, operations, and risk management.
Organizations can improve their forecasting performance by focusing on data consistency, feature design, and integrating operational signals into decision-making.
Conclusion + CTA
PTF forecasting is hard because it’s not merely “tomorrow’s price” it’s tomorrow’s market-clearing equilibrium under changing conditions:
weather-driven demand shifts, renewable uncertainty, outages, and grid constraints [1][5][6][10].
The practical way forward is a data-driven pipeline that respects bid-time information, avoids leakage,
produces scenario-aware outputs, and connects price insights to HPP operational risk.
- Week 1: EPİAŞ data + baseline features + leakage checklist [2][3]
- Week 2: Weather + demand uncertainty + spike labeling [5][6]
- Week 4: SCADA coupling for “price × deliverability” decision support
If you would like to learn more about data-driven approaches to PTF forecasting and energy market decision-making, feel free to contact us: