Bearing Failure Detection through Vibration Analysis: Common Signals and Early Diagnosis Approaches in Hydroelectric Power Plant Equipment
Introduction
In hydroelectric power plants, turbine and generator bearings are critical components exposed to high loads and prolonged operating periods. Local defects in these bearings generate impulsive vibrations at each contact event. These impulses propagate through the dynamic transfer function of the system and become measurable signals [2].
The impulses generated by localized faults are not purely deterministic; rather, they exhibit stochastic characteristics and are often masked by surrounding mechanical signals [1].
Therefore, early diagnosis of bearing failures cannot rely solely on monitoring overall vibration levels. It requires advanced signal processing techniques such as impulsive component separation, appropriate frequency band selection, and envelope analysis [1].
Especially in low-speed hydro turbines, fault signatures tend to be weak and embedded in noise. Consequently, accurate feature extraction becomes critically important.
TL;DR
- Bearing faults produce impulsive vibrations in the presence of localized damage, and these signals exhibit stochastic characteristics [1][2].
- Characteristic fault frequencies (BPFO, BPFI, etc.) can be enhanced through demodulation and envelope analysis [1][2].
- Spectral kurtosis and kurtogram are effective methods for optimal frequency band selection [3].
- In hydroelectric power plants, low rotational speed and high load conditions increase signal masking effects [4].
- Vibration analytics is a core component of predictive maintenance for early diagnosis and planned intervention.
- Concepts and Theoretical Background
- Physical Basis of Vibration Signals in Bearing Failures
In rolling-element bearings, a localized defect (e.g., a crack on the inner race) produces a short-duration impulse at each contact event. The repetition of this impulse depends on contact geometry, load distribution, and shaft speed [2]. Since the defective point is excited each time a rolling element passes over it, a series of damped impulses appears in the time domain.
However, as this signal propagates through the system’s dynamic transfer function, it spreads and mixes with vibrations from surrounding mechanical components. As a result, the measured signal is not a purely periodic waveform but a complex structure with stochastic and impulsive characteristics [1].
Randall and Antoni demonstrated that localized bearing faults can be modeled as “pseudo-cyclostationary” processes and distinguished from deterministic gear signals [1]. This distinction is critical for accurate fault diagnosis.
- Characteristic Bearing Fault Frequencies
In localized faults, specific frequencies become prominent in the vibration spectrum. These frequencies depend on bearing geometry and shaft rotational speed:
- BPFO (Ball Pass Frequency – Outer race)
- BPFI (Ball Pass Frequency – Inner race)
- BSF (Ball Spin Frequency)
- FTF (Fundamental Train Frequency)
These characteristic frequencies help identify which bearing component is damaged. The model proposed by McFadden and Smith shows that in single-point defects, these frequencies become evident in the spectrum after demodulation [2].
Therefore, monitoring only the overall RMS vibration level is insufficient; frequency-domain analysis is essential.
- Envelope Analysis and Band Selection
In localized bearing defects, impulse signals typically appear in high-frequency bands. Since these impulses create amplitude modulation over a carrier resonance frequency, envelope analysis is an effective diagnostic method [1].
However, if the appropriate frequency band is not selected, the impulsive component may remain masked. Spectral kurtosis is used to determine the frequency band where impulsive components are most concentrated [3]. The kurtogram approach enables optimal band-pass filter design prior to performing envelope analysis [3].
These techniques play a critical role in isolating weak signals, particularly in low-speed hydro turbine bearings where fault signatures are often subtle and heavily masked by noise [4].
These calculations are critically important for preventing misdiagnosis during spectrum interpretation.
- How Vibration Analytics Works (Signal → Feature → Alarm)
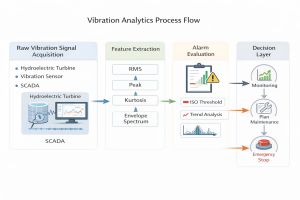
(Figure 1. Illustrates the analytical process steps vibration data undergoes from raw signal to operational decision.)
- Raw Signal and Preprocessing
Vibration analysis begins with time-domain data acquired from accelerometers. This data is typically broadband and contains not only bearing-related impulses but also contributions from shafts, gears, and hydraulic effects.
In hydroelectric power plants, low rotational speed and high torque conditions may result in low overall signal amplitude, while load-related harmonics remain relatively strong [4].
At this stage, the following preprocessing steps are typically applied:
- Noise reduction
- Order tracking (elimination of rotational speed fluctuations)
- Appropriate band-pass filtering
The objective is to make the fault-related impulsive component as visible as possible within the signal [1].
- Feature Extraction
Raw vibration signals are not sufficient for direct alarm generation. Therefore, specific features are extracted:
- RMS (overall energy level)
- Peak value (impulse amplitude)
- Kurtosis (indicator of impulsiveness)
- Peak frequencies in the envelope spectrum
Kurtosis statistically indicates the presence of sudden impulses within the signal. Spectral kurtosis helps identify the frequency band where the impulsive component is concentrated [3].
After envelope analysis, the appearance of characteristic frequencies such as BPFO and BPFI in the spectrum is interpreted as an indicator of localized damage [1][2].
This stage represents the critical bridge between signal processing and diagnostic decision-making.
- Alarm Generation and Threshold Evaluation
Once features are defined, the alarm logic is activated. This logic can operate in two ways:
- Static threshold approach (based on general vibration limits such as ISO 20816)
- Trend-based approach (evaluation of temporal increase patterns)
ISO 20816 defines acceptable vibration limits for machinery and provides a reference for general condition assessment. However, for early detection of localized bearing faults, envelope spectrum analysis and impulsive indicators are more sensitive methods [1].
Trend analysis is particularly effective for early warning in low-speed hydro turbines, where absolute amplitude increases may remain limited.
- Decision Layer
In the final stage, the extracted features are translated into maintenance decisions:
- Monitoring
- Planned intervention
- Emergency shutdown
This decision is not based solely on vibration level; it also depends on equipment criticality, load conditions, and the production schedule. Since production loss costs are high in hydroelectric power plants, early and accurate diagnosis is critical for operational continuity [4].
- Common Vibration Signatures and Diagnostic Challenges in HPP Equipment
- Low-Speed Turbine Bearings
In hydroelectric power plants, turbine bearings typically operate at low rotational speeds (low RPM). Low speed results in lower characteristic fault frequencies. This creates two major challenges:
- Fault frequencies appearing in the spectrum with low energy
- Masking effects caused by broadband vibrations from hydraulic flow
The literature indicates that vibration sources in hydro power stations originate not only from mechanical components but also from hydraulic and electromagnetic effects [4]. Therefore, low-frequency bearing faults may overlap with hydraulic harmonics.
In such environments, relying solely on overall RMS levels is insufficient for early fault detection.
- Generator Bearings and Electromechanical Interaction
Bearings on the generator side exhibit different dynamic characteristics compared to those on the turbine side. Magnetic field effects and rotor misalignment can introduce additional components into the vibration spectrum.
This complicates the separation of deterministic signals (e.g., rotor frequency harmonics) from impulsive fault components. Randall and Antoni demonstrated that bearing fault signals can be separated from deterministic gear signals using advanced signal processing techniques [1].
For this reason, envelope analysis and appropriate band selection become even more critical for generator bearings.
- Hydraulic-Induced Masking
In hydro turbines, flow irregularities, cavitation, and load variations generate broadband vibration. These vibrations can suppress impulsive signals originating from localized bearing defects.
Spectral kurtosis is an effective method for identifying frequency bands where impulsive components are present under masking conditions [3]. Particularly in low signal-to-noise ratio environments, the kurtogram approach provides advantages for early diagnosis.
- Commonly Observed Bearing Failures
Frequent bearing failure types in HPP equipment include:
- Inner race crack (BPFI dominant)
- Outer race damage (BPFO dominant)
- Rolling element surface degradation (BSF component)
- Surface wear due to insufficient lubrication
The model developed by McFadden and Smith demonstrated that single-point localized defects produce repetitive and measurable impulses [2]. Therefore, spectrum analysis is a powerful tool for identifying the fault location.
- Case Study: Early Detection of Inner Race Damage in a Turbine Bearing
In an 18 MW Francis turbine at a hydroelectric power plant, a slight increase in vibration trend was observed in the lower turbine bearing. Although the overall RMS value remained below ISO 20816 limits, a consistent upward trend was detected over the past three months.
- Time-Domain Analysis
No clear periodic structure was observed in the raw acceleration signal. However, short-duration impulses were noticeable in the high-frequency band.
Although these impulses initially appeared irregular, order tracking revealed that they repeated synchronously with shaft rotation.
Such impulsive structures are reported in the literature as indicators of localized bearing faults [1][2].
- Spectral Kurtosis and Band Selection
When spectral kurtosis analysis was applied, a distinct concentration of impulsive energy was identified in the 4–6 kHz range.
According to the kurtogram output, envelope analysis was performed within this frequency band [3].
This stage is critical, as incorrect band selection may mask the fault component and lead to misdiagnosis.
- Envelope Spectrum Result
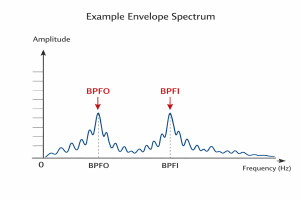
(Figure 2. The prominence of characteristic bearing fault frequencies (BPFO and BPFI) in the envelope spectrum is an indicator of localized damage.)
In the envelope spectrum, the harmonics of the BPFI frequency—calculated based on shaft speed—became clearly visible. This finding strengthened the likelihood of inner race damage [2].
Although the overall RMS value had not yet reached the alarm threshold:
- The kurtosis value had increased
- The characteristic frequency became prominent in the envelope spectrum
- The trend analysis showed an upward trajectory
When these three indicators were evaluated together, an early-stage inner race defect was diagnosed.
- Intervention and Outcome
During the scheduled maintenance period, the bearing was dismantled, and an initial crack on the inner race was confirmed. Thanks to early diagnosis:
- Unplanned downtime was prevented
- Turbine damage was avoided before escalation
- No production loss occurred
This case demonstrates that impulsive signal analysis and the envelope approach are effective even in low-speed hydro turbines [1][4].
- Digital Analytics Layer: Converting Vibration Data into Operational Decisions with Hydrowise
Vibration analysis is not merely a signal processing task; without proper infrastructure, it cannot be integrated into operational decision-making. In hydroelectric power plants, high-frequency vibration data from sensors must be evaluated together with SCADA systems.
The Hydrowise platform provides a three-layered approach:
- Data Acquisition and Synchronization
- SCADA process data (load, speed, temperature)
- Vibration sensor data (acceleration, velocity)
- Alarm history and maintenance records
These data streams are synchronized and transferred to the analytics layer. Order tracking and rotational synchronization are particularly important in hydro turbines where low-speed fluctuations occur [1].
- Feature and Trend Analytics
The Hydrowise analytics module automatically generates features such as:
- RMS
- Peak
- Kurtosis
- Envelope spectrum peak frequencies
Impulsive fault components are isolated using spectral kurtosis-based band selection and envelope analysis algorithms [3].
Through trend analysis, not only threshold exceedance but also growth tendencies are evaluated. This approach provides a critical advantage in detecting early-stage localized defects.
- Alarm and Decision Layer
When generating alarms, the system does not rely solely on vibration levels. It simultaneously evaluates:
- Equipment criticality score
- Load level
- Production Schedule
- Previous failure history
This integrated assessment reduces unnecessary shutdowns while making genuine risks visible at an early stage.
Since production loss costs are high in hydroelectric power plants, an accurate alarm strategy is essential for operational continuity [4].
- Predictive Maintenance Integration
Over time, vibration features can feed statistical models to estimate Remaining Useful Life (RUL). The literature shows that integrating condition monitoring data with prognostic models improves maintenance planning [1].
This approach enables:
- Optimization of intervention timing
- Reduction of unplanned downtime risk
- Balancing of maintenance costs
Vibration analytics serves as the primary data source for this structure.
- Conclusion and Evaluation
Early detection of bearing failures is critical for operational continuity, especially in asset-intensive facilities such as hydroelectric power plants. Localized defects generate impulsive vibrations, which are often masked beneath general vibration levels [1][2].
Envelope analysis, spectral kurtosis, and evaluation of characteristic fault frequencies enable early diagnosis even in low-speed turbine and generator bearings [1][3]. Although hydraulic and electromechanical effects complicate signal interpretation in HPP environments, proper band selection and trend analysis effectively overcome these challenges [4].
Transforming vibration data into operational decisions is not solely a matter of signal processing; it must be addressed together with data integration, trend tracking, and equipment criticality assessment.
As a next step, the feature extraction capacity and band selection methods of the existing vibration monitoring infrastructure should be reviewed. Alarm logic should rely not only on threshold exceedance but also on trend evaluation and characteristic frequency analysis.
This approach reduces the risk of unplanned downtime while improving the predictability of maintenance planning.
- Frequently Asked Questions1- How can a bearing fault be detected when the overall RMS level is low?
Localized bearing defects are typically impulsive in nature and may contribute only minimally to the overall energy level (RMS). Therefore, methods such as envelope analysis, kurtosis, and characteristic frequency tracking should be used [1][3].2- Why are BPFO and BPFI frequencies important?
These frequencies depend on bearing geometry and indicate which component is damaged. The appearance of their harmonics in the envelope spectrum helps identify the fault location [2].3- Why is vibration analysis more challenging in low-speed hydro turbines?
Low rotational speed results in fault frequencies with low energy levels. Additionally, broadband vibrations caused by hydraulic effects may mask impulsive components [4].4- Is spectral kurtosis always necessary?
In environments with high noise and masking effects, spectral kurtosis optimizes band selection and contributes to early diagnosis [3]. However, in cases with a high signal-to-noise ratio, classical envelope analysis may be sufficient.5- Is ISO 20816 sufficient for early bearing fault detection?
ISO 20816 provides general condition assessment based on overall vibration levels. However, early detection of localized bearing faults requires envelope and frequency-domain analysis [1].