Real-Time Anomaly Detection: Cyber Attack Detection via SCADA Data
Physical Process Modeling, ML Hybrid and Hydrowise AI-Powered Early Warning
Renewasoft | 2026
Level: Advanced Audience: SCADA Engineer, HPP Operator, CTO, Infrastructure Investor
Introduction: SCADA Data as a Cybersecurity Signal Line
In energy generation facilities, SCADA data was long used solely for operational reporting. However, today SCADA streams have simultaneously become a cybersecurity signal line. Modern attacks often reveal themselves not through direct network traffic, but through very small yet meaningful deviations in the physical process: setpoint manipulations, sensor drift, unexpected actuator command frequency, disruption of flow–pressure–frequency relationships, and instantaneous harmonic spikes in vibration spectra[1].
The importance of this approach is explicitly emphasized in NIST ICS guidelines[1], the IEC 62443 series[2], MITRE ATT&CK for ICS[3], and CISA’s ICS-focused advisories[4]. This section aims to present an end-to-end framework for how real-time anomaly detection fed by SCADA can be designed, from physical process modeling to ML-based methods, feature engineering, false positive management, SIEM integration, and Hydrowise’s early warning approach.
TL;DR — Executive Summary
- “Normal” is not a fixed baseline; it is a contextual function depending on operating mode, season, load and equipment condition[1].
- Physical process modeling (mass/energy balance, digital twin) is the foundation for distinguishing statistical deviation from cyber manipulation[1][3].
- The best architecture is hybrid: SPC/EWMA (fast signal) + ML (interpretation) + physical model (consistency)[1][2].
- False positive management is achieved through multi-stage validation, context-aware thresholds and alarm consolidation[1].
- Hydrowise unifies data integration, context labeling, anomaly scoring, explainability and incident management in a single platform[1][4].
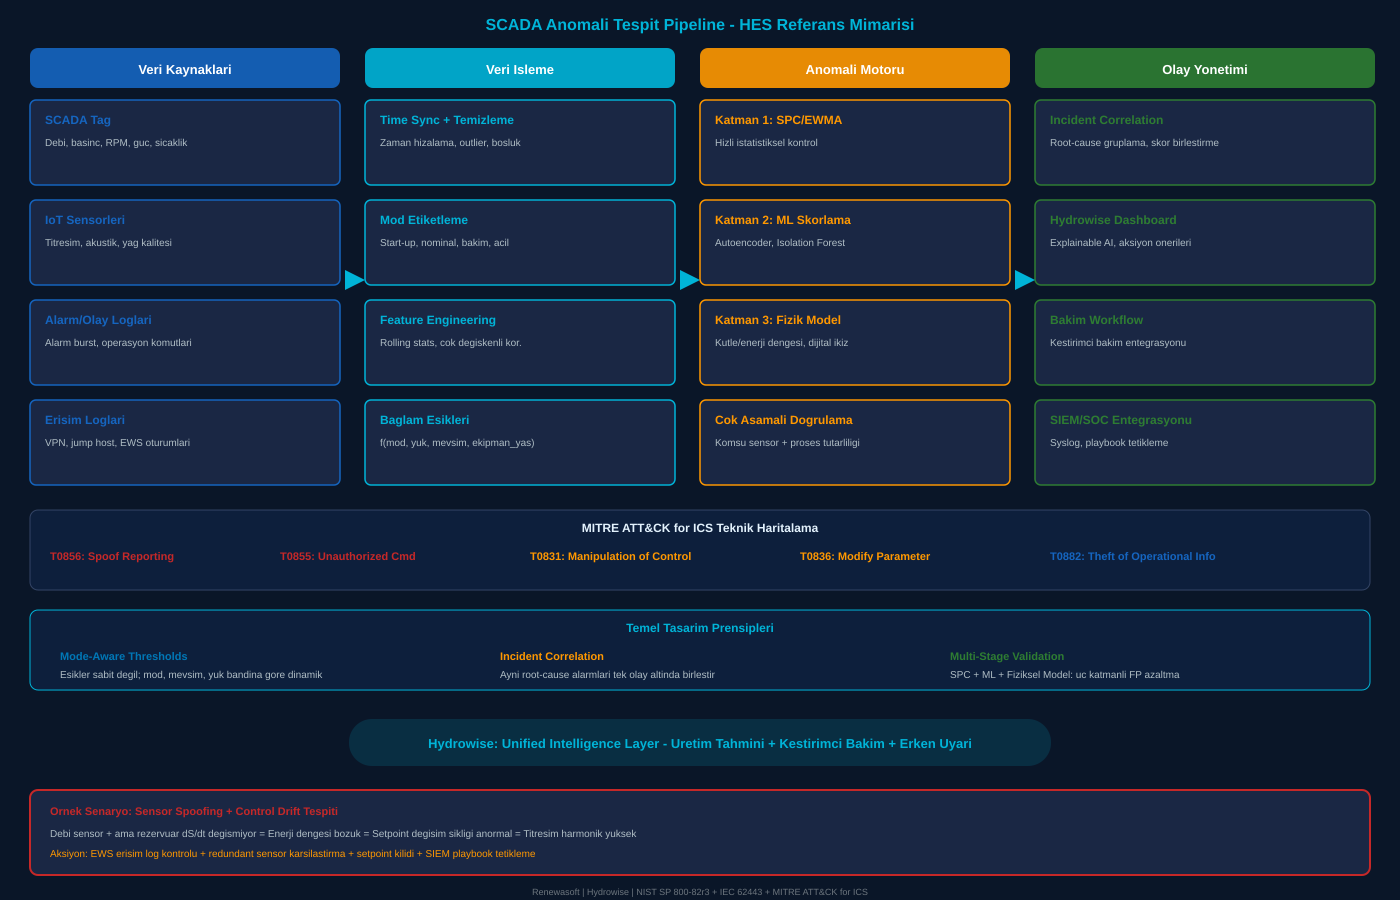
Infographic: SCADA Anomaly Detection Pipeline — HPP Reference Architecture [1][2][3]
You Cannot Find Anomalies Without Defining “Normal”
The first and most critical step in anomaly detection is defining “normal.” In SCADA environments, “normal” is not a fixed baseline as in office IT systems. In HPPs, process dynamics are inherently variable: seasonal flow changes, reservoir level behaviors, turbine loading profile, operator interventions, sensor calibrations, and hydraulic/mechanical wear[1][2].
| Operating Mode | Normal Behavior Pattern | Anomaly Threshold Approach |
|---|---|---|
| Start-up / Synchronization | Rapid RPM increase, transient vibration peaks | Wide-band thresholds; duration-based timeout |
| Nominal Production | Stable flow–power–frequency correlation | Narrow-band; mode-conditioned SPC |
| Load Increase/Decrease | Ramp profile; transient overshoot/undershoot | Matching with ramp duration and direction |
| Maintenance / Bypass | Sensor offline, control loop disabled | Anomaly detection suspended or special mode |
| Emergency | Trip, fast shutdown, protection relay active | Post-event forensic analysis mode |
Table 1: Operating Modes and Anomaly Threshold Approaches [1][2]
The recommended approach for defining “normal” is to produce a labeled “operational state” field in the data layer. This label can be created directly from SCADA (e.g., operating mode tags) or through rule-based derivation (e.g., breaker open/closed, RPM, active power)[1].
Physical Process Modeling: Correlation Is Not Enough, Causality Is Needed
The critical difference that elevates SCADA anomaly detection to a cyber attack context: not merely statistical outliers, but physical process consistency must be sought. An attacker can manipulate sensor values to force the operator into wrong decisions. This manipulation may appear plausible on a single sensor while contradicting process physics[1][3].
A) Constraint and Invariant-Based Modeling
Mass conservation, energy balance, hydraulic pressure–flow relationships; turbine efficiency curves; reservoir level change rate (dS/dt) with inlet–outlet flow balance. For example: if flow appears to increase while active power remains the same → efficiency drop or telemetry manipulation. If flow increases without pressure increase → sensor spoofing suspicion[1].
B) Simplified Digital Twin Logic
A full CFD/FEA digital twin is expensive; for operational purposes a reduced-order model is used: flow, net head, turbine blade angle, governor command, generator load → expected power. This model provides two things: (1) Interpretability: what deviated, why might it have deviated? (2) Attack discrimination: process fault, sensor fault, or cyber manipulation?[1][2]
Statistical Anomaly vs ML-Based Anomaly: When to Use Which?
| Method | Advantage | Disadvantage |
|---|---|---|
| Z-score / MAD | Fast, inexpensive, transparent | Misses multivariate relationships |
| EWMA / CUSUM | Good at catching drift and small deviations | May be insufficient for complex processes |
| Hotelling T² | Collective deviation in correlated tag sets | Weak at root-cause discrimination |
| Isolation Forest | Powerful in unlabeled, high-dimensional data | Does not inherently model time dependency |
| Autoencoder / LSTM-AE | Anomaly via time series reconstruction error | Data quality, drift, explainability cost |
| TCN / Transformer | Captures lag and multivariate relationships | High training and maintenance cost |
Table 2: Anomaly Detection Methods Comparison [1][2]
💡 Practical Recommendation: Three-Layer Hybrid Architecture
Layer 1 (Speed): Fast signal generation with statistical SPC/EWMA.
Layer 2 (Depth): Interpretation and classification with ML (fault, manipulation, or process change?).
Layer 3 (Consistency): Physical process model residual check (physics-in-the-loop).
This triad provides speed + accuracy + explainability[1][2].
Feature Engineering: From SCADA Tag Flood to Meaningful Signal
What determines ML quality is often feature engineering rather than the model itself. Raw SCADA data is like a tag flood; it must be converted into meaningful signals[1].
| Feature Category | Example Features | Cyber Detection Value |
|---|---|---|
| Time Domain (Basic) | Rolling mean/std, trend, rate-of-change, step-change | Setpoint jump, drift detection |
| Multivariate Relational | Flow↔power, pressure↔flow, governor↔RPM↔frequency | Process consistency check, spoofing detection |
| Frequency Domain (Vibration) | FFT band powers (1X, 2X), spectral centroid, envelope | Mechanical stress, cavitation, manipulation trace |
| Alarm/Event Log | Alarm burst rate, sequence pattern, ack delays | Alarm suppression/storm detection, attack trace |
Table 3: HPP-Focused Feature Engineering Categories [1][2][3]
Critical: Do not blindly adopt correlation; use mode-conditioned correlation. The expected relationship in nominal production differs from start-up mode[1].
False Positive Management: Generating Alarms Is Easy, Not Fatiguing the Operator Is Hard
A system that continuously produces false alarms leads to alarm fatigue (operator disengagement) or threshold blinding at the site[1][2]. Three techniques to manage this:
| Technique | Mechanism | Example |
|---|---|---|
| Multi-Stage Validation | Stage-1: SPC candidate + Stage-2: ML score + Stage-3: process consistency | Flow increased → does reservoir dS/dt match? Does pressure support it? |
| Context-Aware Thresholds | Threshold = f(mode, load, season, equipment_age) | Winter flow vs summer flow = different thresholds |
| Alarm Consolidation | Group same root-cause alarms within an incident | RiskScore = AnomalyScore × AssetCriticality × Exposure |
Table 4: False Positive Reduction Techniques [1][2]
SIEM Integration: Bringing OT Anomalies to Enterprise Incident Management
If SCADA anomaly detection remains as a standalone dashboard, its impact is limited. SIEM integration requires two principles: (1) OT telemetry must be correlated with IT telemetry — for example, remote EWS access + setpoint change + flow–power inconsistency within the same time window dramatically increases attack probability[3][4]. (2) Event format must be standardized: timestamp, asset_id, anomaly_type, confidence, severity, recommended_action, supporting_evidence.
Real Scenario: Manipulated Sensor + Control Drift
💥 Attack Scenario
The attacker gains unauthorized access to the engineering workstation. Objective: not to directly stop the turbine, but to create efficiency loss, increasing economic damage and equipment stress[6].
Step 1: Shows the flow sensor higher than actual → the operator decides to increase production.
Step 2: Gradually increases governor setpoint → increments too small to trigger classic alarm thresholds.
Physical Result: Turbine exits efficiency curve; cavitation risk increases; harmonic rise in vibration spectrum.
How Does the Anomaly Detection System Catch This?
| Detection Layer | Control Mechanism | Result |
|---|---|---|
| Cross-Consistency | If flow increases, reservoir dS/dt should increase; it doesn’t | Sensor spoof suspicion |
| Energy Balance | Expected power ≠ measured power → model residual increase | Physical model alarm |
| Command Pattern | Setpoint changes unusually frequent/rhythmic | Command frequency anomaly |
| Vibration Correlation | Higher-than-expected harmonic increase | Mechanical stress signal |
Table 5: Sensor Spoofing + Control Drift Detection Mechanisms [1][3]
When these mechanisms work together, the event is collected not as a single alarm but as an incident: Suspected Sensor Spoofing + Control Drift (Confidence: High). Actions: EWS access log check, redundant sensor comparison, setpoint lock, SIEM playbook trigger[3][4].
Hydrowise Approach: AI-Powered Early Warning Layer
Hydrowise differentiates by connecting anomaly detection not only to security but simultaneously to performance and risk management layers. The platform collects SCADA + IoT + market data in a single unified intelligence layer, producing three outputs under one roof: production forecasting, predictive maintenance, and early warning.
| # | Phase | Description |
|---|---|---|
| 1 | AI-Powered Data Integration | SCADA tags, sensors and IoT streams securely collected, normalized, time-synchronized |
| 2 | AI-Powered Data Analysis | Context labeling (operating modes), feature store, model scoring pipeline runs |
| 3 | AI-Powered Forecasting | Scoring that discriminates performance deviations (efficiency drop) and security anomalies (spoof/drift) |
| 4 | Decision Support | Events connected to dashboard, maintenance workflow, operational decisions and SIEM incident management |
Table 6: Hydrowise Anomaly Detection Pipeline [1][4]
🔍 Hydrowise Critical Design Principles
Explainable AI: Not just “alarm triggered”; explains “which signal disrupted which relationship.”
Model Drift Management: Adaptive models for seasonal changes; sub-models specific to different operating modes.
Secure Integration: Data collection without breaking IT/OT separation; aligned with Purdue/DMZ architecture[5].
Operational Output: Action recommendations that answer the operator’s question: “What should I do?”
Frequently Asked Questions (FAQ)
Q1: Can SCADA data alone catch a cyber attack?
It can be sufficient; however, for increased accuracy, correlation with access logs, alarm/command logs and additional telemetry like IoT vibration is recommended[3][4].
Q2: Is labeled attack data required to train the ML model?
Not always. One-class approaches and autoencoders can learn deviation from normal. Labeled data is useful for classification and root cause discrimination[1].
Q3: What if concept drift (seasonal change) corrupts the model?
Mode-based models, adaptive thresholds and periodic retraining are needed. Drift is monitored with model health metrics[1][2].
Q4: What is the most effective way to reduce false positives?
Not a single method; multi-stage validation + context awareness + alarm consolidation must be designed together[1][2].
Q5: Should we send raw SCADA tags to SIEM?
No. Sending semantically enriched event objects (incident/event) is correct; raw data overwhelms the SOC[4].
Q6: How do we distinguish sensor fault from manipulation?
Redundant measurement, physical process consistency (invariant), command/access correlation and temporal pattern analysis are used together[1][3].
Q7: What does Hydrowise productize in this process?
It unifies data integration, context labeling, anomaly scoring, explainability, incident management and decision support layers in a single platform.
Q8: How is latency managed in real-time systems?
A hybrid of edge pre-processing + heavy central analysis can be applied. Critical thresholds fast at edge, deep analysis at center[1].
Conclusion
Real-time anomaly detection in HPPs is not merely an operational health indicator, but an early warning line that captures the physical traces of cyber attacks. A successful system defines the context of normal, seeks consistency through process modeling, performs hybrid scoring, manages false positives, and connects to SIEM[1][2][4].