Real-Time Monitoring: How to Design Alarm Generation in SCADA (Threshold, Trend and Anomaly Approaches)
When real-time monitoring in energy facilities (especially hydropower plants) is mentioned, many teams first ask, “Is data flowing on the screen?”. Yet operational value does not come from the flow of data; it comes from the operator seeing the right thing at the right time. This brings alarm design—namely, “under what conditions do we treat something as an alarm, and how do we present it?”—to the center. A poorly designed alarm system increases safety and production risk through alarm floods, alarm fatigue, and unnecessary interventions. For this reason, standards treat alarm management not as a configuration task but as an engineering discipline with a lifecycle [1][2].
In this blog post, we address SCADA alarm generation holistically through three core approaches (threshold, trend, and anomaly). We will design a rule set with an example scenario in the hydropower context, and then connect it to a “field-ready” implementation architecture from a Hydrowise/Renewasoft perspective.
TL;DR
- Alarm design is not “setting limits”; it is a lifecycle that includes philosophy, rationalization, KPI monitoring, and change management [1][2].
- Threshold alarms are fast but not sufficient alone: if there is no deadband, delay, priority, and context, nuisance alarms increase [2].
- Trend/derivative alarms detect incipient failures early and enable “earlier, calmer intervention” for operators.
- Anomaly detection (statistical/ML) captures “unknown unknowns”, but model drift, explainability, and false-positive management are essential [3][4].
- The best approach: measure with alarm KPIs (alarms/hour, flood definition, etc.), rationalize, test, then deploy; also support HMI/operator ergonomics with guidance such as ISA-101 [5][6].
Concepts and Background:
Alarm, event, and notification distinction
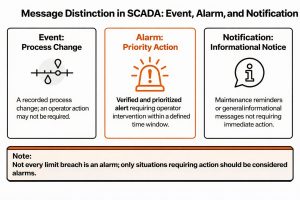
Not everything seen on a SCADA screen is an “alarm”. A practical distinction:
– Event: A record of a process change. Operator action may not be required.
– Alarm: A prioritized and validated warning that requires operator action within a defined time window.
– Notification: Informational reminders, maintenance calls, etc.
The IEC 62682 and ISA-18.2 approach treats an alarm as an element that requires operator action and requires this property to be preserved throughout the lifecycle [1][2]. Defining every limit violation as an alarm devalues alarms.
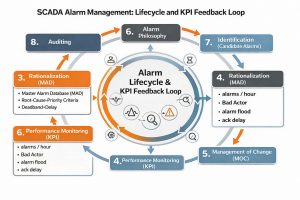
Alarm lifecycle and “alarm philosophy”
Within the ISA-18.2/IEC 62682 framework, alarm management includes creating an alarm philosophy, selecting alarm candidates, rationalization, detailed design, implementation, operation/maintenance, performance monitoring, change management, and auditing [2][1]. The critical point is this: alarm management is not a project done once and left behind; it is a living process.
The “alarm philosophy” document defines the objectives (safety, environment, equipment, production), the priority logic, classification, alarm color/label standards, responsibilities (“who does what and when”), test procedures, and KPI targets [2].
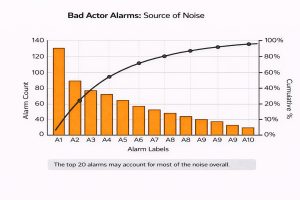
Alarm flood and KPIs
An alarm flood is a situation where alarms are generated faster than the operator can handle, causing correct intervention to be delayed. EEMUA 191 and industry practice recommend defining flood conditions with measurable metrics (e.g., more than 10 new alarms in 10 minutes) [7]. ISA-18.2 also emphasizes performance monitoring and KPIs [6].
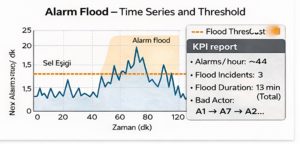
Example KPIs used throughout this post:
– Average alarm rate (alarms/hour)
– Top 20 noisiest alarms (“bad actor alarms”)
– Number and duration of alarm floods
– Acknowledgement (ack) latency and operator workload indicators (human factors studies show that alarm management affects workload) [8]
How does it work? Three Core Approaches to Alarm Generation
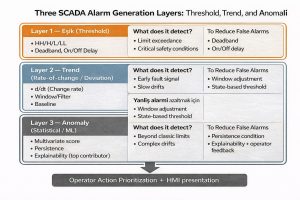
1) Threshold-based alarm
The most common method is that the process variable PV exceeds certain limits: HH/H/L/LL. However, in practice the following “micro-tunings” are critical:
– Deadband (hysteresis): Reduces chattering alarms around the boundary.
– On-delay / Off-delay: Filters short spikes and separates “real” problems [9].
– Setpoint dynamics: State-based limits depending on operating conditions (e.g., turbine startup, gate movement, maintenance mode).
– Prioritization: Based on safety/equipment/production impact and time criticality.
Why is it not enough alone? Because threshold logic often catches the “result.” When a bearing temperature reaches HH, the failure is already close; the trend approach provides earlier signals.
2) Trend (rate-of-change / deviation) based alarm
Trend alarms use the rate of change (d/dt) or deviation from expected behavior as the alarm condition. Examples:
– “Flow does not increase although gate opening increases by 2%” (efficiency loss / possible blockage)
– “Vibration RMS rises by 30% in 10 minutes” (incipient mechanical problem)
Trend approach provides two benefits:
1) Earlier warning for the operator: the intervention window expands.
2) Reducing alarm floods: targets meaningful change rather than instantaneous spikes.
Key considerations in trend design:
– Sampling frequency and filtering (moving average, median filter)
– Seasonal/operational regime changes (night/day, load changes)
– Defining the “normal trend” (baseline for comparison)
3) Anomaly (statistical / ML) based alarm
Anomaly detection aims to capture “unusual” behaviors that do not fit classical limits. The study by Chandola et al. (2009) systematically classifies anomaly detection by technical categories and assumptions; the key message is: every method operates under specific assumptions, so the method must be selected according to the domain [3][4].
In a SCADA/ICS context, anomaly detection can be used to capture early signs of equipment failures, sensor faults, process deviations, or cyber manipulation. Recent literature evaluates the performance of deep-learning-based anomaly approaches on ICS measurement data [10]. However, success in production depends not only on AUC/accuracy but also on the following operational conditions:
– False-positive cost: if operator trust is lost, the system is disabled.
– Drift and retraining: the model shifts as the process/equipment changes (concept drift).
– Explainability: a reasonable answer to “why did you raise this alarm?”
– Security integration: monitoring and logging processes for OT security (NIST OT security guidance) [11].
Hydropower/Energy Facility Impact: Why Alarm Design Creates Business Value?
Operator performance and risk
Alarm floods increase the operator’s cognitive load and raise the risk of missing a critical alarm. Human-in-the-loop studies examining the effect of alarm management and automation on workload and performance highlight this relationship [8]. ISA-101 also emphasizes that HMI design should be handled with usability and performance focus [5].
Production loss, health equipment, and safety
Hydropower alarm design is directly related to:
– Unplanned downtime and production loss (turbine, generator, transformer, gate/trash rack issues)
– Water management decisions (flow, reservoir level, gate position)
– Environmental compliance (minimum ecological flow, flood control)
– Cyber resilience (unexpected command/measurement deviations)
NIST OT/ICS guidance emphasizes that monitoring/logging and security controls must be considered together with OT reliability and safety requirements [11]. The alarm system is a critical “early warning” layer not only for the process but also for security.
Example Scenario: Designing an Alarm Rule Set in a Hydropower Plant (Mini Flow)
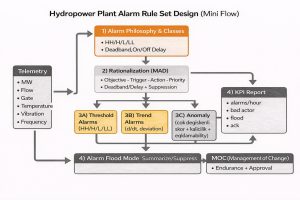
The goal in the scenario below is to generate early warnings without increasing the alarm count and to clarify “operator action”.
Scenario
In a hydropower plant, the following telemetry is collected from the turbine unit:
– Active power (kW/MW)
– Flow (m³/s)
– Gate/wicket angles (%)
– Generator bearing temperature (°C)
– Vibration (RMS mm/s)
– Oil pressure (bar)
– Grid frequency (Hz)
Target
1) Keep “instant threshold” alarms to a minimum
2) Early warning with trends
3) Capture complex deviations with anomalies
4) Automatic suppression/summarization rules during alarm floods (suppression/shelving)
Step-by-step design (aligned with ISA-18.2 / IEC 62682)
Step 1 — Alarm philosophy and classes
– Critical (Safety/Trip), High (Equipment protection), Medium (Operational), Low (Advisory) classes; label standard; ack requirement [2][1].
Step 2 — Alarm rationalization (Master Alarm Database)
For each alarm, fill in: tag, condition, purpose, possible causes, operator action, expected time, priority, deadband/delay, suppression conditions [2][9].
Step 3 — Three-layer alarm generation
(A) Threshold alarms
– Vibration HH: RMS > X mm/s and on-delay 30 s (filter short spikes)
– Bearing temperature HH: T > Y °C and off-delay 60 s (hysteresis)
– Oil pressure LL: P < Z bar (critical; fast)
(B) Trend alarms (early warning)
– Vibration rate: d(RMS)/dt > a threshold (10-minute window)
– Temperature trend: +ΔT over 20 minutes (dynamic threshold by operating state)
– Efficiency deviation: (MW / flow) ratio drops by k% in 15 minutes → possible trash rack blockage/gate issue
(C) Anomaly alarms (contextual)
– Multivariate anomaly score: deviation from normal behavior learned from vector [MW, flow, gate, vibration, temperature, oil pressure].
– Threshold: score > s and persists for 5 minutes → “Anomaly Warning (Advisory)”
– Explanation: top 3 contributing variables (e.g., vibration + temperature + efficiency)
Step 4 — Alarm flood management
– Flood definition: >10 new alarms in 10 minutes → “alarm flood mode” [7]
– In flood mode: summarize low-priority advisory alarms; bring critical alarms to the front.
– Automatic review list for “bad actor” alarms (weekly)
Step 5 — KPIs and continuous improvement
– Daily/weekly alarm report: alarms/hour, top 20 noisiest alarms, flood events, ack delays [6][7].
– Change management: alarm limits and suppression rules are updated via an MOC process [2].
Technical Note: Alarm Lifecycle (ISA-18.2 / IEC 62682)
- Alarm Philosophy → standards, KPI targets, roles
- Identification → alarm candidate pool
- Rationalization → eliminate unnecessary alarms, set priority/action
- Implementation → HMI + logic + test
- Monitoring & Assessment → KPI, bad actor, flood analysis
- Change Management & Audit → continuous improvement
(Source: [1][2][6])
Risk Box: Most Common Mistakes in SCADA Alarm Design
- Turning every event into an alarm (alarm inflation)
- Setting limits without deadband/delay (chattering nuisance alarms)
- Not defining operator action (“what should I do?” ambiguity)
- Randomly distributing alarm priorities
- Not monitoring KPIs (the system degrades over time)
- Ignoring HMI design (incompatible with ISA-101 principles) [5]
- Treating the anomaly model as “one-off” (drift and loss of trust) [3][11]
7 Rules to Reduce Alarm Floods
1) Alarm ≠ Event: If no action is required, it is not an alarm.
2) Do not set limits without deadband + delay.
3) Design state-based alarming (startup/maintenance).
4) Add early warnings with trend alarms.
5) Position anomaly as “advisory + explanation”.
6) Monitor with KPIs: alarms/hour, bad actor, floods.
7) Make it sustainable with MOC (change management).
(Basis: [1][2][6][7][11])
Hydrowise / Renewasoft Approach: “Field-Ready” Alarm Design
At this point, the main question is: “While implementing these principles, how will we manage data flow and operational processes?” From a Hydrowise/Renewasoft perspective, an effective alarm management architecture can be handled in three layers:
1) Data layer: Secure and sustainable telemetry
– Time-series data collection from SCADA (MW, flow, gate, vibration, temperature, etc.)
– Timestamp synchronization (NTP/PTP) and data quality checks
– Alignment with OT security requirements (segmentation, logging/monitoring, authorization) [11]
2) Analytics layer: Hybrid rules + statistics + ML
– Rule engine: threshold and trend alarms (configurable)
– Anomaly service: multivariate score, drift monitoring, explanation generation (feature contribution)
– Alarm correlation: clustering alarms from the same root cause (reduces operator load)
3) Operations layer: Alarm philosophy, KPIs, and change management
– Central management of rationalization outputs via a “Master Alarm Database” approach [2][9]
– KPI panel: alarms/hour, flood events, bad actor list [6][7]
– MOC process: limit updates, suppression rule changes, version tracking [2]
Internal link suggestions (site):
– /hydrowise/scada-integration
– /hydrowise/real-time-monitoring
– /hydrowise/predictive-maintenance
– /renewasoft/ot-security
External authority links:
– NIST OT security guide (SP 800-82r3) [11]
– IEC 62682 alarm management standard page [1]
Frequently Asked Questions (FAQ)
1) When is the number of alarms “too high”?
A single number does not fit every facility; however, ISA-18.2 and industry practice recommend managing with KPIs (alarms/hour, flood definition, etc.) [6][7].
2) Are threshold alarms or anomaly detection better?
These are complementary, not competing. Threshold for protection, trend for early warning, anomaly for complex deviations [2][3].
3) How do I reduce false positives?
Deadband/delay, state-based suppression, trend window optimization, and persistence conditions for anomaly scores should be used together [2][9].
4) What should we do during an alarm flood?
First define and measure (e.g., >10 alarms in 10 minutes), then summarize/suppress low priorities and improve bad actors [7][6].
5) How is alarm rationalization done in practice?
With a workshop (operator + maintenance + process + automation), write the “purpose–cause–action” trio for each alarm; the result is a Master Alarm Database [2][9].
6) How often should the anomaly model be updated?
Depends on process change; drift monitoring and a periodic retraining plan are required [3][11].
7) Does HMI design affect alarm performance?
Yes. ISA-101 recommends a usability and performance focused HMI approach; it is directly related to alarm visibility and operator workload [5].
Conclusion
SCADA alarm generation is far more than setting limits: if it is not managed with a lifecycle approach (philosophy → rationalization → KPI → MOC), alarms turn into noise over time. In hydropower plants, this noise increases production loss, equipment damage, and safety risk. The most effective result is achieved by designing threshold + trend + anomaly approaches together with operator ergonomics and performance KPIs [1][2][5][6].
Actionable next steps:
1) Inventory your current alarms (1-week KPI report).
2) Select the first 20 bad actor alarms and run a rationalization workshop.
3) Add a trend alarm for one critical asset (e.g., turbine bearing).
4) Start an anomaly pilot as “advisory + explanation”.
5) Enable the KPI panel + MOC process with Hydrowise.
References
[1] International Electrotechnical Commission (IEC). IEC 62682:2014 — Management of alarm systems for the process industries. 2014. (https://webstore.iec.ch/en/publication/7363) Accessed: 2026-02-22
[2] International Society of Automation (ISA). Understanding and Applying the ANSI/ISA 18.2 Alarm Management Standard (PAS). (PDF). (https://www.isa.org/getmedia/55b4210e-6cb2-4de4-89f8-2b5b6b46d954/PAS-Understanding-ISA-18-2.pdf) Accessed: 2026-02-22
[3] Chandola, V., Banerjee, A., & Kumar, V. Anomaly Detection: A Survey. ACM Computing Surveys, 41(3). 2009. (https://dl.acm.org/doi/10.1145/1541880.1541882) Accessed: 2026-02-22
[4] Chandola, V. et al. Anomaly Detection: A Survey (technical report PDF). 2009. (https://cucis.ece.northwestern.edu/projects/DMS/publications/AnomalyDetection.pdf) Accessed: 2026-02-22
[5] International Society of Automation (ISA). ISA-101 Series of Standards (HMI usability and performance). (https://www.isa.org/standards-and-publications/isa-standards/isa-101-standards) Accessed: 2026-02-22
[6] Yokogawa. Implementing Alarm Management per the ANSI/ISA-18.2 Standard (Control Engineering). (https://www.yokogawa.com/tr/library/resources/media-publications/implementing-alarm-management-per-the-ansi-isa-182-standard-control-engineering/) Accessed: 2026-02-22
[7] Emerson. Alarm Management By the Numbers (EEMUA-191 metrics). (PDF). (https://www.emerson.com/documents/automation/article-alarm-management-by-numbers-deltav-en-38292.pdf) Accessed: 2026-02-22
[8] Besuijen, R. et al. Impact of alarm management and automation on abnormal operations: A human-in-the-loop simulation study. 2023. Accessed: 2026-02-22
[9] Emerson. Alarm Rationalization — White Paper. (PDF). (https://www.emerson.com/documents/automation/white-paper-alarm-rationalization-deltav-en-56654.pdf) Accessed: 2026-02-22
[10] Zhao, X. et al. Anomaly Detection Approach in Industrial Control Systems Based on Measurement Data. Information, 13(10), 450. 2022. (https://www.mdpi.com/2078-2489/13/10/450) Accessed: 2026-02-22
[11] Stouffer, K. et al. NIST SP 800-82 Rev. 3 — Guide to Operational Technology (OT) Security. 2023. (https://csrc.nist.gov/pubs/sp/800/82/r3/final) Accessed: 2026-02-22